


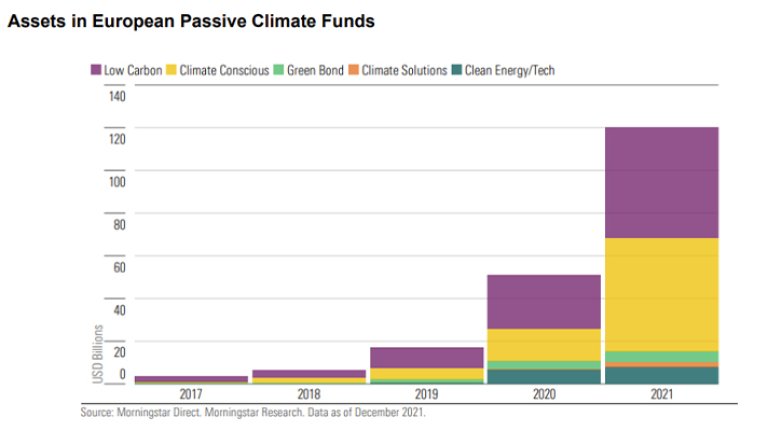
Growth in climate-aware index investing has exploded over the last couple of years. Morningstar research, in Figure 1, shows assets in climate index funds in Europe reached over $120bn at the end of 2021, more than doubling in one year (1) . There is now an abundance of strategies available for climate-conscious passive investors with 50 'passive' funds tracking the new EU climate benchmarks within just 12 months of their launch (1) .
Figure 1 – Growth in Climate- Conscious Index Funds
This growth is set to continue in response to increasing investor demand, with two thirds of institutional investors planning to switch their passive equity exposures to ESG or climate benchmarks over time (2). A recent survey by FTSE Russell showed that 86% of asset owners globally are now integrating sustainable investments into their portfolios, with the main drivers being risk mitigation and the potential for improved long-term returns (3). The latest Mercer asset allocation survey reported that 26% of European Pension Funds have already made use of a low carbon/climate-related index and this proportion is expected to continue growing (4).
Regulation is also an increasingly powerful driver behind the shift to climate-aware investing (5)
The UK government has introduced new governance and reporting legislation and guidance to ensure that climate change is at the top of the agenda for pensions trustees (5). The Department for Work and Pensions (DWP) has emphasised climate change as a material financial risk that trustees must measure, monitor and manage. The Pensions and Lifetime Savings Association (PLSA) highlighted that trustees may use climate-risk indices as "part of an approach to manage climate-related risks and integrate them into the investment process" (6). The government's guidance also includes that trustees might consider "a shift in passive investments to low carbon benchmarks rather than tracking a market-capitalisation weighted index" (7).
Having recognised climate change as a financially material risk, and a part of their fiduciary and legal duties, how can trustees manage and balance this against a need for low-cost solutions and the continued trend towards passive investing?
Traditionally passive investing has been viewed as a low cost, low governance option for trustee boards. It has allowed for more of the governance budget to be spent on active investment decisions, such as asset allocation and selecting active managers that deploy skill to either deliver returns above the market or manage specific identified risks.
Aside from investment choices related to geography (developed markets vs all countries), company size (large & mid vs all cap) and any exclusion requirements (weapons, tobacco etc.) the selection of which brand of global equity index to track makes little difference to the investor's risk/return profile, as illustrated in Figure 2.
Figure 2 – Market-Cap Global Equity Benchmarks - little room for divergence
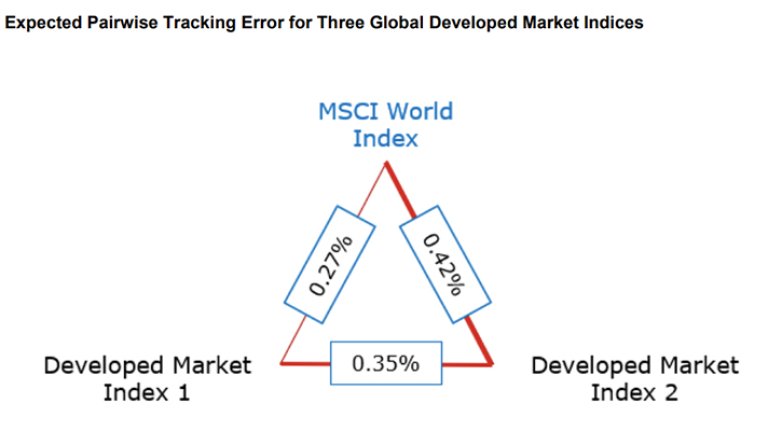
The method for creating a market cap index is clear cut and allows for minimal deviation.
The same cannot be said for indices designed to target risks associated with the transition to a low carbon or 'Paris aligned' economy. There is a plethora of climate index strategies available. Here, the choice of index makes a big difference to the outcome for investors and can expose trustee boards to large unintended, unmanaged and unexpected sources of risk. In stark contrast to market cap data, which allows companies to be sorted according to size, there is no universally agreed metric for 'climate risk' or 'Paris alignment' by which companies can be ranked in an index.
Early 'low carbon' indices often retained large fossil fuel, and even thermal coal, exposures (8). Their static and simplistic methodologies, based on limited and imperfect data, led to climate risk being reallocated along the value chain, rather than effectively managed or minimised. In practice this meant that while holdings in oil and gas majors could be reduced, large positions in oil and gas supply companies remained, leaving investors with meaningful exposure to climate transition risks. Further, such strategies were unable to account for forward-looking corporate transition plans. These were superseded by various iterations of low carbon/climate aware index funds and in late 2019 the EU Commission stepped in to define both Climate Transition Benchmarks (CTB) and Paris Aligned Benchmarks (PAB) with a recipe for construction intended to bring a level of standardisation to the market (9). Despite these initiatives, however, the deviation between the indices remains considerable.
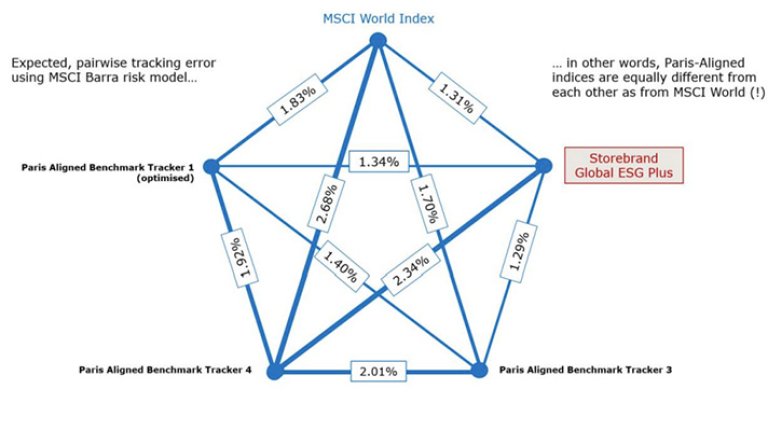
There is too much subjectivity in index construction for these benchmarks to be considered 'passive' investment options for trustees. The outcomes vary substantially, as illustrated in Figure 3.
Figure 3 – Huge Variation in Climate Global Equity Benchmarks
Our observation that "index-tracking" is not equivalent to "passive" is supported by several recent academic papers. For example, 'Closet Active Management of Passive Funds' examined the active share of all US equity funds coded as index funds or ETFs in the Centre for Research in Security Prices (CRSP) database and concluded: "A third of these funds exhibit more activeness than the median actively managed fund". They also found that so-called 'passive' funds vary widely by style and factor exposures, even more so than active funds (10). We have found this to be true of "passive" funds in the climate index space and present the EU Paris Aligned indices as an example.
A feature of EU PABs is that emissions reduction is defined as an initial 50% drop in carbon emissions relative to the market cap index, followed by an annual cut of 7%12. A recent paper, by Osmosis, illustrates the problems this rigid approach presents for fiduciaries13. The 7% p.a. emissions reduction is based on an IPCC Paris aligned pathway for 1.5ºC with no or low overshoot. In the real world, however, policy is failing to move us towards climate goals in this systematic fashion, meaning that these benchmarks can become increasingly detached from reality. They do not take an informed approach to climate risk management – where data, policy and science continue to evolve. Active risk exposures relative to the market are largely ignored – hence the large tracking error figures relative to the MSCI World Index illustrated in Figure 3. The use of carbon emissions reduction is a useful tool for managing risk exposures but not sufficiently robust as a standalone proof statement for 'Paris Alignment'. We can illustrate this with a simple example.
Figure 4 – Aligning MSCI World with the PAB Methodology in Two Simple Steps
Step 1 – we start with MSCI World and sort the companies by carbon intensity, highest to lowest.
Step 2 – we iteratively remove companies, starting with most CO2 intensive, until the carbon intensity reductions match those of the PAB guidelines in size. In 2022, a 50% reduction is modelled, followed by 7% year-on-year thereafter until 2050.
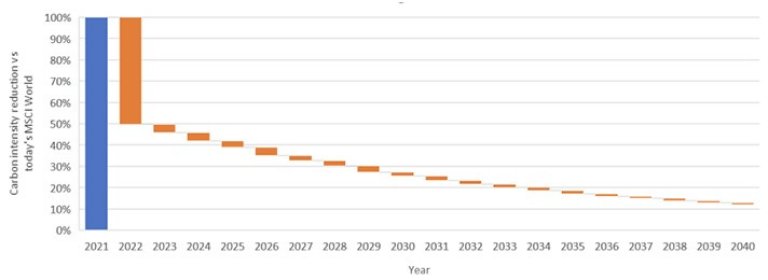
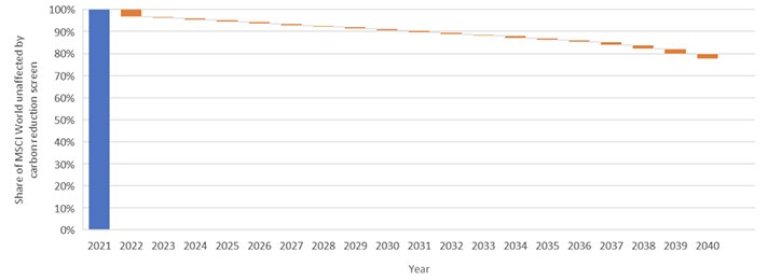
Figure 5 – The Reality of PAB-aligned Emissions Reduction
This second chart shows the % weight of MSCI World that must be removed in order to meet the annual emissions intensity reduction above.
By simply screening out less than 5% of the index constituents it could be considered Paris aligned for three years, to 2024. By 2030 only 10% of the index would need to be screened. However, this would not be aligned with the economic decarbonisation required to achieve the interim 2030 Paris goals and certainly at odds with the required transition in terms of technologies, products and services.
Sources of Difference
There are many reasons why climate indices differ from one another so greatly, despite following the EU rulebook for either PABs or CTBs.
Data sources
Widespread adoption of the Taskforce on Climate-Related Financial Disclosures (TCFD) framework has gone some way to standardising carbon emissions metrics by stipulating a methodology for calculating carbon intensity and absolute emissions. However, there are multiple sources for the raw company emissions data used as inputs to these metrics, and they differ by provider. Large gaps remain in company reported data; around 40% of the constituents of the FTSE All-World Index "do not currently disclose" their Scope 1 and Scope 2 emissions "requiring the use of estimated data instead" (13) . There are even more missing data points for Scope 3 emissions which account for 85% of total emissions (14). Further, estimated carbon emissions data is inaccurate; a FTSE Russell study found that "almost half of estimated values diverge from reported data by 100%", substantially impacting the accuracy of carbon intensity in a global equity portfolio (15).
Data discrepancies are particularly challenging when benchmarks rely on complex scores or ratings in portfolio construction. The CFA Institute studied ESG scores from different providers and found they present vastly disparate results for the same companies (16). The European Fund and Asset Management Association (EFAMA) has urged the European Commission to regulate ESG ratings (17) . Implied Temperature Rise (ITR) scores and transition alignment metrics are increasingly popular but hugely methodologically dependent and often 'black boxes'. A study by the Louis Bachelier Institute concluded that ITR metrics "hide layers of analysis, assumptions, and uncertainties" and demonstrate little comparability or correlation in results. They cautioned that few ITRs could be considered suitable for assessing “compatibility with the temperature objective of the Paris Agreement” (18). We believe it is questionable to consider any products constructed using highly subjective, opaque and inconsistent metrics, data sets and methodologies as 'passive' index funds. The FCA appears to agree – it recently issued a warning on ESG benchmarks, stating "We believe that the subjective nature of ESG factors, and how ESG data and ratings are incorporated into benchmark methodologies, give rise to an increased risk of poor disclosures in ESG benchmark statements” (19).
Portfolio construction
The way in which data is used to construct a portfolio is arguably more important than the choice or source of data inputs. For example, the index designer / portfolio manager must decide how to weight and prioritise backward-looking reported carbon emissions metrics, company green revenues and forward-looking ITR scores in portfolio construction.
The method used for position sizing has a meaningful impact on risk. The investment universe for a climate index is typically a broad, market cap-weighted benchmark. Portfolio weights are then determined either by scaling the index positions up or down according to their input scores (such as CO2 intensity), or through portfolio optimisation, whereby an optimiser will systematically weight companies according to the selected data inputs while aiming to minimise risk relative to the investment universe. Either of these methods can lead to unintended risks without the oversight of a portfolio manager who can continuously refine the model.
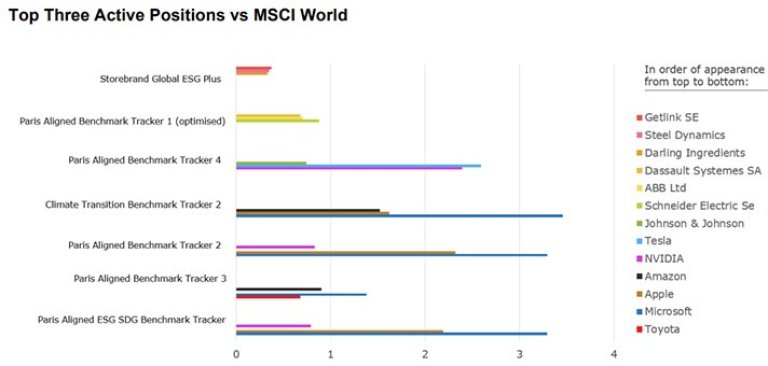
For example, in delivering products that generate green revenues, companies will generate Scope 1 and 2 emissions. A climate solutions company may subsequently be underweighted in optimisation, based on its carbon intensity data, unless the strategy is holistically managed by a skilled portfolio manager. For mega-cap companies, scaling a company's market cap weight by a factor of e.g., three can lead to large individual stock risks, such as systematically overweighting Tesla due to its green revenues. Indices tend to be rebalanced infrequently, meaning that the portfolio will drift, often substantially, from the optimal climate-risk balanced index design.
The outcome of the methodological choices and data inputs used in portfolio construction can be judged using active share (defined as the absolute value of the difference between the portfolio and the market-cap index starting point) and tracking error (also versus the market-cap index starting point). As investors concerned about climate risk in the broader index, we should be comfortable with a level of tracking error and active share – we want our portfolios to differ from the carbon-heavy benchmark – but, crucially, we want the differences to be attributable to our climate-related goals. We should also be mindful of taking on any unintended, unexpected and unmanaged sector, country or individual stock risks that might impact relative returns.
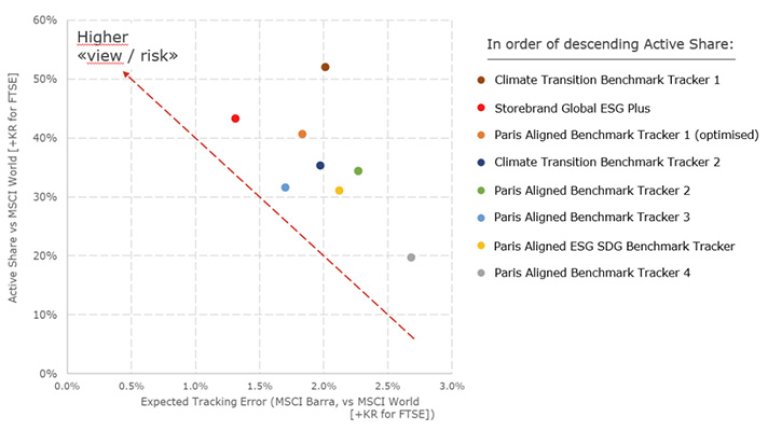
Figure 6 charts the active share and tracking error of a variety of PAB and CTB trackers, showing us how much active share each fund achieves per unit of risk (tracking error), relative to the MSCI World Index. A fund in the top left corner would demonstrate high active share per unit of risk. Provided the sources of risk (differences from the index) are attributable to climate-related factors, then this would be considered a strong climate view for a low relative risk.
Assessing tracking error and active share versus the market cap weighted index offers a better way to understand active versus passive than whether or not a strategy is created by an index provider or an asset manager. This is discussed in a recent academic paper called 'The Active World of Passive Investing' (20).